You can code a python script to automate and extract data from the Google Analytics4 API. Let’s see how we can get the top 5 pages viewed in the past 90days.
The aim of this project is to have a script that goes through your Google analytics4 API everyday and pulls the top 5 most viewed pages along with the number of users. It puts this data in a json format.
The github repository of the project can be found here. It is still recommended to read through the steps.
Prerequisites :
- Google developer profile :
To get one, sign in to your Google account and activate it by going to developers.google.com.
- A Google analytics property setup.
This can be a blog or a website whose analytics you want to track. If you want to learn more about how to set up Google analytics for your website, click here.
- Google Analytics 4 API setup.
In order for your python script to work you should have Google Analytics 4 API setup and working for your project. If you want to know how to set up the Google Analytics API for your project, click here.
Setting up the Python Project
- Create a virtual environment
Make a project folder. Open terminal and navigate to it. Now, you need to set up a virtual environment.
python -m venv venv- Activate the virtual evironment
To activate the virtual environment on windows:
.venv\Scripts\activate To activate the virtual environment on mac:
source venv/bin/activate- Add new files to project folder
Make a new python file. Let’s call it post.py.
Make a directory called data. In that directory, make a file called posts.json.
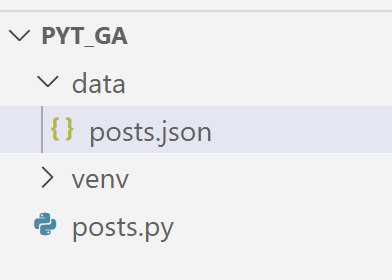
This is what your file structure should like now:

Configure the Google Analytics API
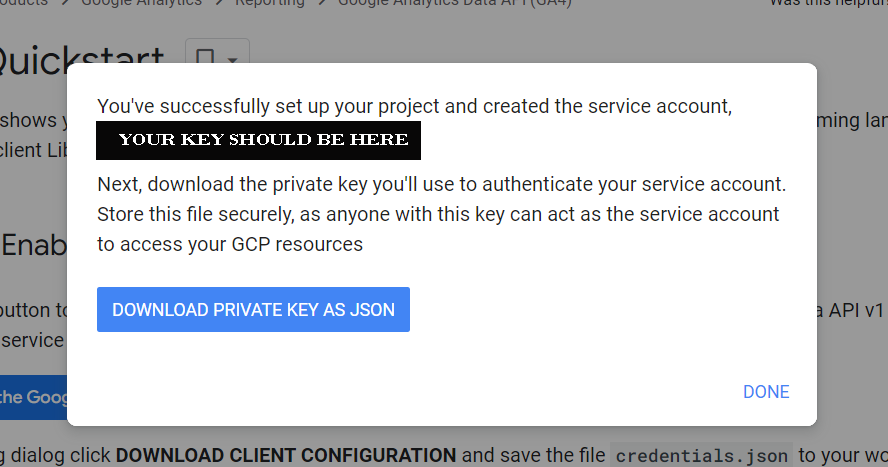
While setting up the Google Analytics API, you would get a secret key in the form of a json file. This is what the key should look like:

Download and move this key to the root of your project directory. Rename it to a more readable name, such as service_account.json. Now your folder structure should look like this:

Now set the path of your key in your post.py.
To do this import os.
Then use the os library to set the GOOGLE_APPLICATION_CREDENTIALS environment variable like so:
1 2 3 | import osos.environ['GOOGLE_APPLICATION_CREDENTIALS'] = 'PATH' |
Where ‘PATH’ is the path to your json file containing the secret key. In this case, the service_account.json which is in your root directory.
1 2 3 | import osos.environ['GOOGLE_APPLICATION_CREDENTIALS'] = 'service_account.json' |
The above steps assume that you have setup your Google Analytics 4 API for your project and added the service account as user. This is described in this article.
Install the Google Analytics Library
Make sure that your virtual environment is activated. In the terminal, run:
pip install google-analytics-dataNOTE:
If you have a different usecase or project idea check the dimensions and metrics of the Google analytics API in their official documentation here.
Setup your Property ID and .env file
To note your property id, go to the admin option in your Google analytics (Like in the step above). Your property id should be on the top next to the property name. It should be a sequence of numbers written in brackets like (123456789).

In order to keep your property id private, it’s recommended to use a .env file. To do this:
- Install
dotenv:
pip install python-dotenv- In your project’s root directory, make a
.envfile. Add your property id to this file.
PROPERTY = 123456789Replace 123456789 with your property id.
- Now in your main file, in this case, your
posts.pyfile add this:
1 2 3 4 | from dotenv import load_dotenvload_dotenv()PROPERTY = os.getenv('PROPERTY') |
This should successfully import the property id from the .env file to your main project without exposing it publicly.
Setup .gitignore
Git is a free and open source distributed version control system. You may eventually want to push you code to github using git. Having a .gitignore file makes it easy to hide all the extra and private information while sharing what would be useful for others.
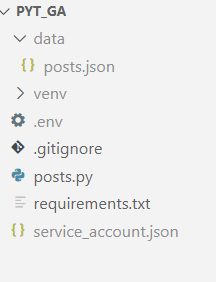
In order to do this, create a .gitignore file in the root of your project directory. Your folder structure should now look like this:

Open your .gitignore file and enter the following:
venv
__pycache__/
.env
service_account.json
data
Write your report
Before we start writing code, it is important to understand the basic request parameters in a google analytics request. To construct a request, you should have:
- A valid entry in the dateRanges field.
- At least one valid entry in the dimensions field.
- At least one valid entry in the metrics field.
To read about it on Google analytics documentation, click here.
Basically, dimensions are attributes of your data. In this case, the dimension PagePath indicates the URL of the page. Metrics are quantitative measurements. The metric Sessions is the total number of active users.
Limit is the number of results to the desired number.
In this case, it would return the top 5 pages based on active users in the past 90 days.
Now let’s make code a request object:
1 2 3 4 5 6 7 8 9 10 11 12 | def run_report(property_id=PROPERTY): client = BetaAnalyticsDataClient() request = RunReportRequest( property=f"properties/{PROPERTY}", dimensions=[Dimension(name="pagePath")], metrics=[Metric(name="activeUsers")], date_ranges=[DateRange(start_date="90daysAgo", end_date="today")], limit=5, ) response = client.run_report(request) print(response) |
This would give you the reponse in this form:
dimension_headers {
  name: "pagePath"
}
metric_headers {
  name: "activeUsers"
  type_: TYPE_INTEGER
}
rows {
  dimension_values {
    value: "/"
  }
  metric_values {
    value: "52"
  }
}
rows {
  dimension_values {
    value: "/category/webframeworks/"
  }
  metric_values {
    value: "7"
  }
}
rows {
  dimension_values {
    value: "/category/general/"
  }
  metric_values {
    value: "4"
  }
}
rows {
  dimension_values {
    value: "/category/python/"
  }
  metric_values {
    value: "4"
  }
}
rows {
  dimension_values {
    value: "/category/webfundamentals/"
  }
  metric_values {
    value: "4"
  }
}
row_count: 26
metadata {
  currency_code: "USD"
  time_zone: "America/Los_Angeles"
}
kind: "analyticsData#runReport"
To make this readable and transfer this to the post.json file, we iterate over this response and write it in the json file.
1 2 3 4 5 6 7 8 9 10 11 | def write_json(response): with open('data/posts.json', "w")as f: for rowIdx, row in enumerate(response.rows): f.write("\n") for i, dimension_value in enumerate(row.dimension_values): f.write(f"{dimension_value.value}|") for i, metric_value in enumerate(row.metric_values): f.write("\t\t") metric_name = response.metric_headers[i].name f.write(f"{metric_name}: {metric_value.value}") |
Now we connect the two functions together. Your final code should look like:
1 2 3 4 5 6 7 8 9 10 11 12 13 14 15 16 17 18 19 20 21 22 23 24 25 26 27 28 29 30 31 32 33 34 35 36 37 38 39 40 41 42 43 44 45 | import osfrom dotenv import load_dotenv#Google Analytics API Importsfrom google.analytics.data_v1beta import BetaAnalyticsDataClientfrom google.analytics.data_v1beta.types import ( DateRange, Dimension, Metric, RunReportRequest,)#Setting up environment variablesload_dotenv()PROPERTY = os.getenv('PROPERTY')os.environ['GOOGLE_APPLICATION_CREDENTIALS'] = 'service_account.json'def run_report(property_id=PROPERTY): client = BetaAnalyticsDataClient() request = RunReportRequest( property=f"properties/{PROPERTY}", dimensions=[Dimension(name="pagePath")], metrics=[Metric(name="activeUsers")], date_ranges=[DateRange(start_date="90daysAgo", end_date="today")], limit=5, ) response = client.run_report(request) # print(response) write_json(response)def write_json(response): with open('data/posts.json', "w")as f: for rowIdx, row in enumerate(response.rows): f.write("\n") for i, dimension_value in enumerate(row.dimension_values): f.write(f"{dimension_value.value}|") for i, metric_value in enumerate(row.metric_values): f.write("\t\t") metric_name = response.metric_headers[i].name f.write(f"{metric_name}: {metric_value.value}")if __name__ == "__main__": run_report() |
The github repository of the above project can be found here.
You can configure your script to run each day or each week. This way, you can have a report of the top 5 pages viewed everyday. To automate such that this script runs everyday, you can use cron jobs if you are a mac user. For windows, you can use task scheduler.
